
tutorial01.md 12 KB
title: Introductory tutorial: Get started with XCharts 3.0 in 5 minutes sidebar_position: 11
Note: This tutorial is for XCharts 3.x version only
- Have used Unity, know the basic operation of Unity.
- Understand UGUI and can use UGUI.
- Understand MonoBehavior script usage in Unity, know how to hang scripts, manipulate scripts with code.
XCharts can be imported into a project in any of the following ways:
Source XCharts directly into the project
After downloading the XCharts source code, copy the XCharts directory directly to the Assets directory of the Unity project.
Import XCharts through
Assets/Import PackageAfter downloading the.unitypackage file for XCharts, open Unity and go to the menu bar Assets--> Import Package--> Select.unitypackage import to start using XCharts.
Import XCharts through the Package Manager
For Unity 2018.3 and later, XCharts can be imported through the Package Manager. After opening the Package Manager, run the
Add package form git URL..., input XCharts dead simple URL:https://github.com/XCharts-Team/XCharts.git use XCharts afterwait a moment.You can also add the package directly to the manifest.json file: Open the manifest.json file in the Packages directory and add it under dependencies:
"com.monitor1394.xcharts" : "https://github.com/XCharts-Team/XCharts.git",To update XCharts, remove com.monitor1394.xcharts from the manifest.json file under lock (some versions of Unity may be packages-lock.json) and re-download and compile.
Recommended daemon into XCharts (not required)
XCharts Daemon can ensure update compilation is normal, when the local open TextMeshPro or NewInputSystem would be very useful. After importing Xchart-daemon into a project, when updating XCharts, the Daemon will automatically refresh asmdef according to the status of local TMP, etc., to ensure normal compilation and facilitate the execution of automated processes such as CI-CD.
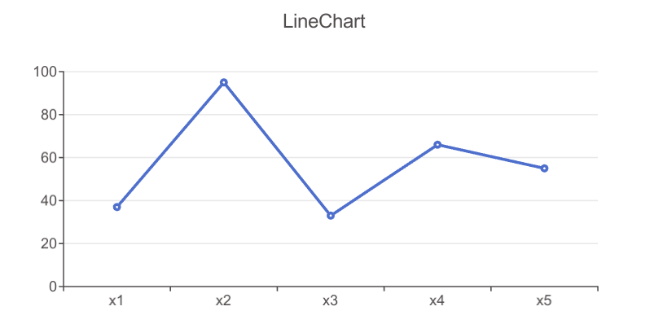
Right-click in Hierarchy view or menu bar GameObject drop down and select XCharts->LineChart, can quickly create a default line chart out:
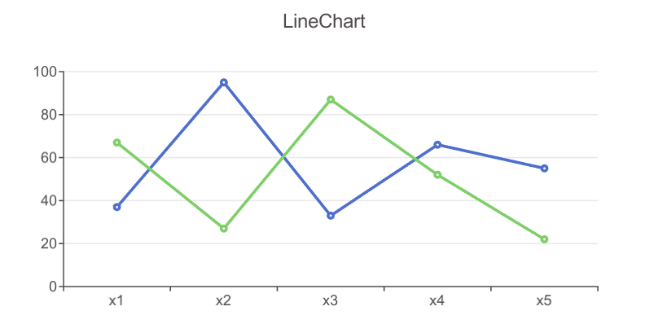
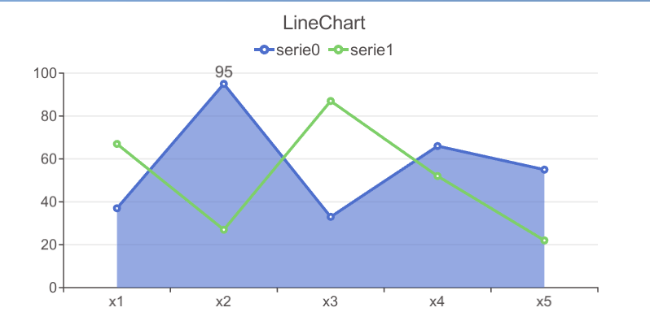
In the Inspector view, locate LineChart's panel, and with the Add Serie button, you can add a second Line line:

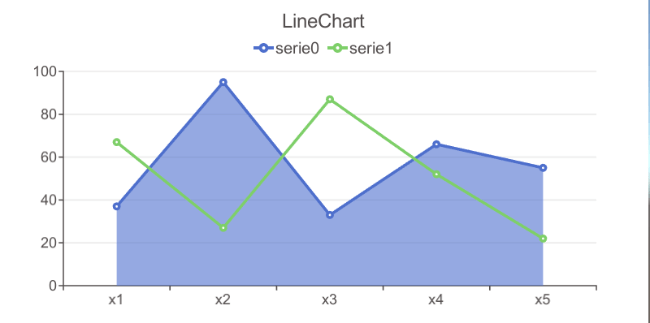
The default chart does not have a Legend, and a Legend Component can be added via the Add Component button:

Serie comes with only a few common components, and others are added as needed. For example, if you need to fill a line chart area with color, you can add a separate AreaStyle component to Serie:

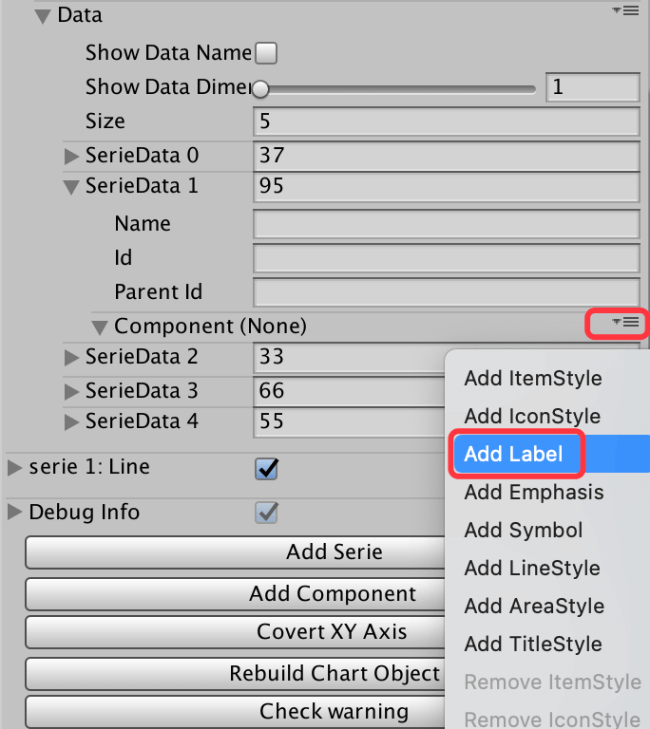
If you need to personalize the configuration of each data item, you can add a Component to each SerieData separately. For example, we give the second data of the line chart a separate display Label:
XCharts has been iteratively optimized and now has dozens of main and sub-components, each with a few to dozens of configurable parameters to support a variety of flexible and complex functions.
Using XCharts for the first time, you can add various charts in the Inspector view, add or adjust the components in the chart, and the Game view gives real-time feedback on the effects of adjustments to familiarize yourself with the use of various components. Detailed parameter descriptions of each component can be found in the XCharts Configuration.
XCharts is configuration and data driven. Want what effect, only need to adjust the configuration parameters under the corresponding component can be, do not need to change the nodes under the Hierarchy view, because those nodes are generated by the XCharts internal according to the configuration and data, even if changed will be restored in the refresh.
How to quickly locate the component corresponding to the effect you want to change requires a certain understanding of the component. For example, if we want to show an arrow at the end of the X-axis, how do we position it? First, position the X-axis to XAxis0; Second, locate the axis to AxisLine; Finally, check to see if there are any parameters in the AxisLine component that can achieve this effect, and check XCharts configuration for uncertain parameters.
XCharts provides a full range of parameter configuration from the globalTheme, seriesSerie, and single data item SerieData. The priority in descending order is: SerieData -> Serie -> Theme. Take the color of ItemStyle for example:
- If the
ItemStyleofSerieDatahas a color value other than0000, this color value is preferred. - If the ItemStyle of
Serieis configured with a color value other than0000, this color value takes precedence. - Otherwise, the Color value is taken from the Color Palette of the Theme.
Usually, 0000 indicates the theme default color, and 0 or null indicates the theme default.
Attach the LineChart script to the gameObject:
var chart = gameObject.GetComponent<LineChart>();
if (chart == null)
{
    chart = gameObject.AddComponent<LineChart>();
    chart.Init();
}
Resize:
chart.SetSize(580, 300);//代码动态设置尺寸,或直接操作chart.rectTransform,或直接在Inspector上改
Set the title:
var title = chart.EnsureChartComponent<Title>();
title.text = "Simple Line";
Set whether prompt boxes and legends are displayed:
var tooltip = chart.EnsureChartComponent<Tooltip>();
tooltip.show = true;

var legend = chart.EnsureChartComponent<Legend>();
legend.show = false;
Set axes:
var xAxis = chart.EnsureChartComponent<XAxis>();
xAxis.splitNumber = 10;
xAxis.boundaryGap = true;
xAxis.type =  Axis.AxisType.Category;

var yAxis = chart.EnsureChartComponent<YAxis>();
yAxis.type =  Axis.AxisType.Value;
Clear default data and add Line type Serie for receiving data:
chart.RemoveData();
chart.AddSerie<Line>("line");
Add 10 data:
for (int i = 0; i < 10; i++)
{
    chart.AddXAxisData("x" + i);
    chart.AddData(0, Random.Range(10, 20));
}
So a simple line chart comes out:

If there are multiple series in a Chart, the data of Axis only needs to be added once, rather than repeated in multiple cycles. Remember: the number of data in Axis should be the same as the number in Serie.
See Examples: Example13_LineSimple.cs for the complete code
You can also use code to control more parameters, there are more Examples under Examples, all the configurable parameters seen in the Inspector can be set by code. All parameters in XCharts configuration can be controlled by code.
In addition, unless customized, it is recommended to call the public interface provided under Chart, especially in the data-related operations section. These interfaces do some associated processing inside, such as refreshing charts. Common interfaces are:
Chart.ClearData(): Clear chart data (without removing Series)Chart.RemoveData(): Clear chart data (will remove all Serie)chart.AddSerie(): AddSeriechart.AddXAxisData(): Add X-axis datachart.AddData(): Adds Serie datachart.UpdateData(): Updates Serie datachart.UpdateXAxisData(): Updates the X-axis datachart.UpdateDataName(): Updates the Serie data name
XCharts has an automatic refresh mechanism inside, but it only triggers under certain conditions. If you call the interface of the internal component, encounter the component did not refresh, and indeed can not find the reason, you can use the following two interfaces to force refresh:
chart.RefreshAllComponent(): refresh chart component, to initialize all of the components, often is not recommended.chart.RefreshChart(): refreshes the chart drawing, only the drawing part is refreshed, and the component text, position, etc., is not refreshed.- Individual components can also refresh only themselves by
SetAllDirty().
XCharts supports TextMeshPro, but it is disabled by default and needs to be switched manually. It can be turned on and off in the following ways:

After opening, you need to set the global font used by TextMeshPro, or you can set it separately in the Theme:
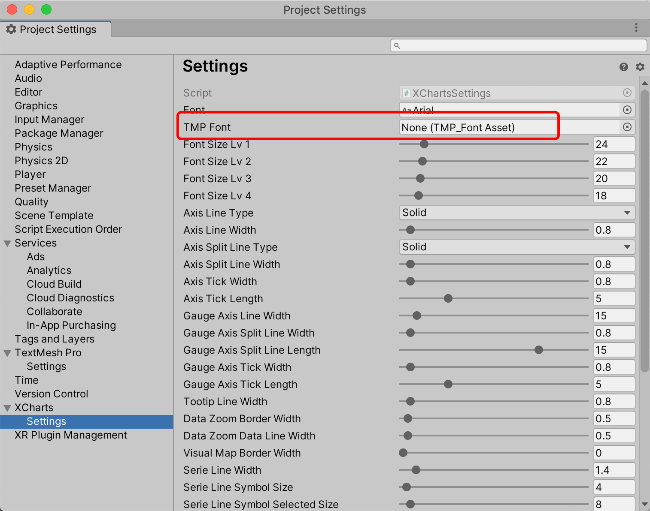
It is recommended to plan whether to use TextMeshPro at the beginning of the project and set the font. When switching TMP with many existing charts, some charts may not refresh automatically. You can manually click the Rebuild Chart Object button to rebuild the chart, which can be initialized normally.
When updating XCharts for TMP projects, you may encounter problems with missing TMP references and failing to compile. These problems can be solved in one of two ways:
- Find
XCharts.Runtime.asmdefandXCharts.Editor.asmdefand manually add references toTextMeshPro - Remove the
dUI_TextMeshPromacro for Scripting Define Symbols in PlayerSetting
Version 3.8.0 after adding daemonXCharts - Daemon, will be XCharts-Daemon import project, When updating XCharts, the daemon automatically refreshes the asmdef based on the locally enabled TMP to ensure proper compilation.
All parameters seen on Inspector can be modified with code, the key is to identify whether the parameters you want to change are on the component, on the Serie, or on the specific data item SerieData.
You need to obtain the component first, and then modify the parameters in it:
var title = chart.EnsureChartComponent<Title>();
title.text = "Simple LineChart";
title.subText = "normal line";

var xAxis = chart.EnsureChartComponent<XAxis>();
xAxis.splitNumber = 10;
xAxis.boundaryGap = true;
xAxis.type = Axis.AxisType.Category;
Note: When the earlier version does not have the EnsureChartComponent() interface, GetOrAddChartComponent() is used.
For newly added Serie:
var serie = chart.AddSerie<Pie>();
serie.center[0] = 0.5f;
serie.center[1] = 0.5f;
serie.radius[0] = 80;
serie.radius[1] = 90;
serie.animation.dataChangeEnable = true;
serie.roundCap = true;
For existing Serie:
var serie = chart.GetSerie<Pie>();
serie.center[0] = 0.5f;
serie.center[1] = 0.5f;
serie.radius[0] = 80;
serie.radius[1] = 90;
serie.animation.dataChangeEnable = true;
serie.roundCap = true;
Add additional components to Serie:
serie.EnsureComponent<AreaStyle>();

var label = serie1.EnsureComponent<LabelStyle>();
label.offset = new Vector3(0,20,0);
var serieData = chart.AddData(0, 20);
//var serieData = serie.GetSerieData(0); //从已有数据中获取
serieData.radius = 10;

var itemStyle = serieData.EnsureComponent<ItemStyle>(); //给数据项添加ItemStyle组件
itemStyle.color = Color.blue;